Saffir-Simpson Scale
What Do Those Dots and Colors Mean?
When you see a forecast map with blue triangles and various colored circles, you have to wonder what each one is. Here is the image from the NOAA (National Oceanic and Atmospheric Association) showing what each means. NOAA through its project Ocean Explorer provides us much of the information we have about our oceans and provides massive amounts of educational materials for students of all ages.
The Saffir-Simpson Hurricane Wind Scale is just that, a scale to tell us how severe the winds in a given storm are.
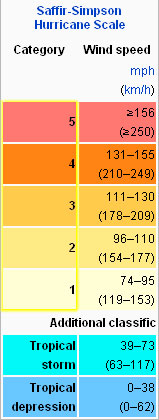
You will note that the tropical depression is a darker blue with wind speeds of up to 38 mph sustained for 1 minute. (62 Km/h). Like so many warning scales that use colors, the worst is red, which is a category 5 hurricane with winds greater than or equal to 156 mph (250 Km/h).
Often you see the tropical depression also represented by a triangle and once tropical storm status is achieved (winds 39 – 73 mph or 63 – 117 Km/k) the symbol becomes a circle and stays that throughout hurricane status.
Storm Surge and Rainfall
While wind is a huge factor in hurricanes and tropical storms there are two other things that are just as important in determining the severity of the storm: Rainfall and Storm Surge.
Noted Storm Surge Hurricanes
In recent storms like Tropical Storm Bertha, the rainfall was 4 to 5 inches in many places and the damages were over $200 million. Probably the least attention is paid to storm surge when can devastate entire communities like with the Galveston hurricane of 1900. A recent storm with a massive storm surge of nearly 28 feet and extreme devastation was hurricane Katrina in 2005. Interestingly, Katrina was not a Category 5 storm, but a Category 3. The storm surge coupled with the poor levy system in New Orleans combined to cost thousands of lives and massive economic damage.
Hurricane With Massive Rainfall
Storms where rainfall was the more devastating culprit are storms like Hurricane Harvey a category 4 storm, which struck Houston in 2017. The devastating rainfall from Harvey ended up causing over $125 Billion in damage and costing 107 lives. The rainfall accumulation was estimated to be from over 40 inches to up to 60 inches in Nederland, TX.
So, when you are watching those maps with their triangles and dots, remember it is not just the wind; you also have to worry about storm surge and rainfall accumulation. Above all, be careful!

Recent Comments